
An owner with clean books asks one more question, and the books can’t answer it.
Where is this going?
The books can say, precisely, where the business has been. Reconciled, classified, documented, the kind of records you could hand to anyone on any Tuesday. A rearview mirror, and a good one. But the decisions that grow a business face forward: who to hire, what to charge, which customer to let go.
So the market offers an answer. Bolt an AI forecast onto the books and call it foresight. You get one confident number about next quarter, and no way to ask why it says that. You can’t build a hiring plan on a number you aren’t allowed to question. A forecast like that is a guess wearing a suit.
Here is what the alternative looks like in our own QuickBooks Online sandbox, a services company with test data. The engine read two years of its books and listed what it flagged, each flag tied to a specific ratio, the change between the two years, and the QuickBooks line item that drove it. Then it proposed actions from a library of plays that a person had reviewed in advance. The policy gate in front of the client-facing view held most of those proposals back until a human looked at them. Each step left a record you can open afterward.
Flour is not the meal
In the last paper, the mill turned raw transactions into flour: books you can defend. This one is about the baker. Flour is data you can lean on. Bread is the decision.
The method stands on work that has aged well. The rearview half comes from 60 Minute CFO by David Duryee and Tracy Bech, a set of ratios across liquidity, safety, profitability and cash flow, anchored by a single survival score. We didn’t invent that mirror. We built forward from it.
Same formulas, new inputs
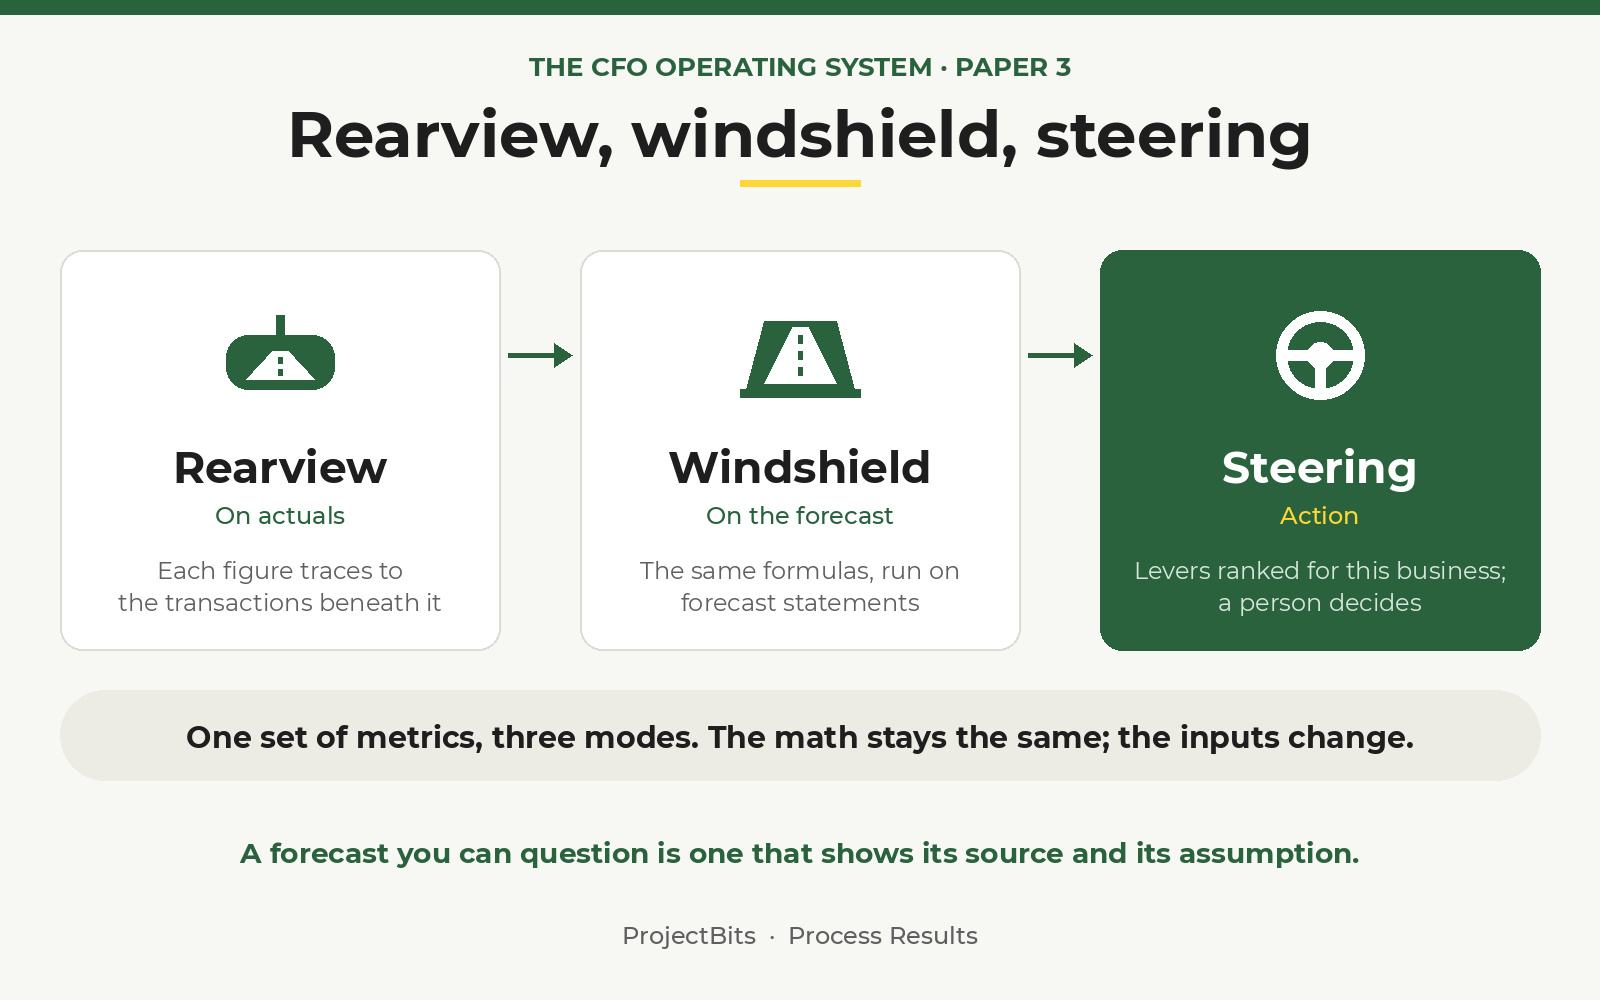
The system runs on one set of metrics in three modes.
Rearview is the ratios on actuals, each figure traceable to the transactions beneath it. Windshield is the same formulas run on forecast statements. The math stays the same and the inputs change, so a projected number is as inspectable as a historical one. Steering is the action: the small moves in price, volume, cost and collection days that matter most to this particular business, turned into a short plan.
That is the one place a person is in the loop by design. And an owner doesn’t learn a new dashboard to see the future. They watch the same number, now with a horizon on it.
We derive revenue, we don't forecast it
Revenue is the output of pipeline execution, so the forecast is built from three sources and then shown.
The first is the recurring base: contracted revenue carried forward, net of your own history of customers who leave. It’s the most certain dollar because it’s already under agreement. The second is the in-flight pipeline, named open opportunities, each weighted by its real stage and expected close week. Not “the pipeline looks healthy,” but these deals, at these odds, in these weeks. The third is modeled new business, what your current lead flow and past conversion produce, lagged by your actual sales cycle. It’s the least certain bucket, and it’s labeled that way.
Each forecast period carries a lineage record, an itemized account of why the model expects the number it expects, by source and assumption. When you ask why next quarter looks the way it does, the answer is a list you can inspect and challenge, not “the model says so.” It’s the same show-your-work standard we use on the books, applied to the future.
When the forecast is wrong
It will be wrong sometimes. The useful question is whether you can find out why.
A period computes each metric it has clean inputs for and marks the rest as pending, not made up. A first-year client with no prior balance sheet gets the gauges that don’t need history and an honest note on the ones that do. A blank is labeled a blank.
Three tiers, by design. Deterministic math runs the ratios. A model interprets: it estimates parameters, flags anomalies, drafts the read. A person approves anything that becomes an action or goes to a client. No model step writes a ratio or commits a decision by itself. The model proposes, the lineage exposes, and a human disposes.
What isn't built yet
The lineage store and the leading-indicator tracking are partly running and partly specification. The week-by-week cash forecast exists as a play in the library, but it isn’t wired to live cash yet. We are building them the way we would walk a client through them: in sequence, measured, without leaping ahead. We would rather tell you which parts run today than draw a diagram where everything does.
And the forecast doesn’t decide for you. It shows where you are heading and what moves the number. Which bet to place is still yours.
If someone handed you a forecast tomorrow, could they show you why, by source and assumption?
If you’d like to see where your own books stand before spending anything, the no-obligation Tax Ready Assessment scores them and names the biggest gaps. The full argument is in the CFO Operating System whitepaper.