
~15 minute read
The CFO Operating System
From Clean Books to Decisions You Can Defend
Our advice
Start with Paper Zero — find yourself first.
Before the frameworks land the way they’re meant to, see which of the five financial personas is running your business today — Which Financial Persona Is Running Your Business? is the recognition on-ramp: find yourself first, then read on. From there, The Two Perspectives names the disciplines — knowledge governance and operational data integration — that determine whether AI produces operating intelligence or expensive theater. The papers below build from that diagnosis to the lab result that tests it.
Reading order
- ★ Which Financial Persona Is Running Your Business? — find yourself first, then read on. ~13 minutes.
- The Two Perspectives — the AI-readiness diagnostic. ~16 minutes.
- Tax Ready Bookkeeping + The AI Stack — the bookkeeping-specific application. ~29 minutes.
- The CFO Operating System — the Stage-4 advisory layer; what clean books are for. ~15 minutes.
- ProjectBits Thought-OS™ — the full methodology umbrella. ~9 minutes.
- AI Debt: The Tax on Small Business — the cost of deploying AI without naming the decisions first. ~22 minutes.
- The Five Questions Test — the lab result: why clean books beat AI infrastructure. ~22 minutes.
- The Hill-Climbing Machine — the ecosystem view: what Satya Nadella got right, and the SMB foundation he skipped. ~20 minutes.
- The Third Perspective — People, Preparation & Readiness; the human discipline behind the harness, for change-management professionals. ~30 minutes.
- The Managed Initiative — the governance capstone: run an AI initiative the way product teams run products, translated for the $5M–$25M owner. ~30 minutes.
- Signal Clarity. Owner Amplification. — the owner’s time is fixed; the return on it is not. The governing layer that amplifies the owner’s judgment, proven on the practice’s own pipeline. ~28 minutes.
Bottom line up front: this whitepaper describes how a business turns trustworthy books into forward-looking decisions — and the discipline that makes the forecast underneath it auditable. It is the Stage-4 advisory layer of the Financial Maturity Staircase: what clean books are for. Paper #3 in the Thought-OS™ reading order.
Don Lovett, Fractional CFO & Managing Principal · ProjectBits Consulting · June 2026
Whitepaper · Version 1.1
Take the No-Obligation Assessment · Schedule 20 Min with Don
Where this fits
This is the prospect-facing paper for the CFO Operating System — the advisory layer that runs on top of clean books. It is the third paper in the series, and it assumes the first two.
Reading order
- The Two Perspectives — the AI-readiness diagnostic. Are you ready to extract value from AI at all? ~16 minutes.
- Tax Ready Bookkeeping + The AI Stack — the bookkeeping application. The mill that turns raw transactions into clean, defensible data. The flour. ~29 minutes.
- The CFO Operating System (this paper) — what that clean data is for. The baker, and the bread. ~15 minutes.
If the grist-mill metaphor from the second paper stuck with you: the mill produces flour, and flour is necessary but it is not the meal. This paper is about the baker — the point at which clean books become a pricing call you can defend, a customer you can fire with the numbers to back it, a growth bet sized against a real cash forecast. Flour is leverageable data. Bread is the decision.
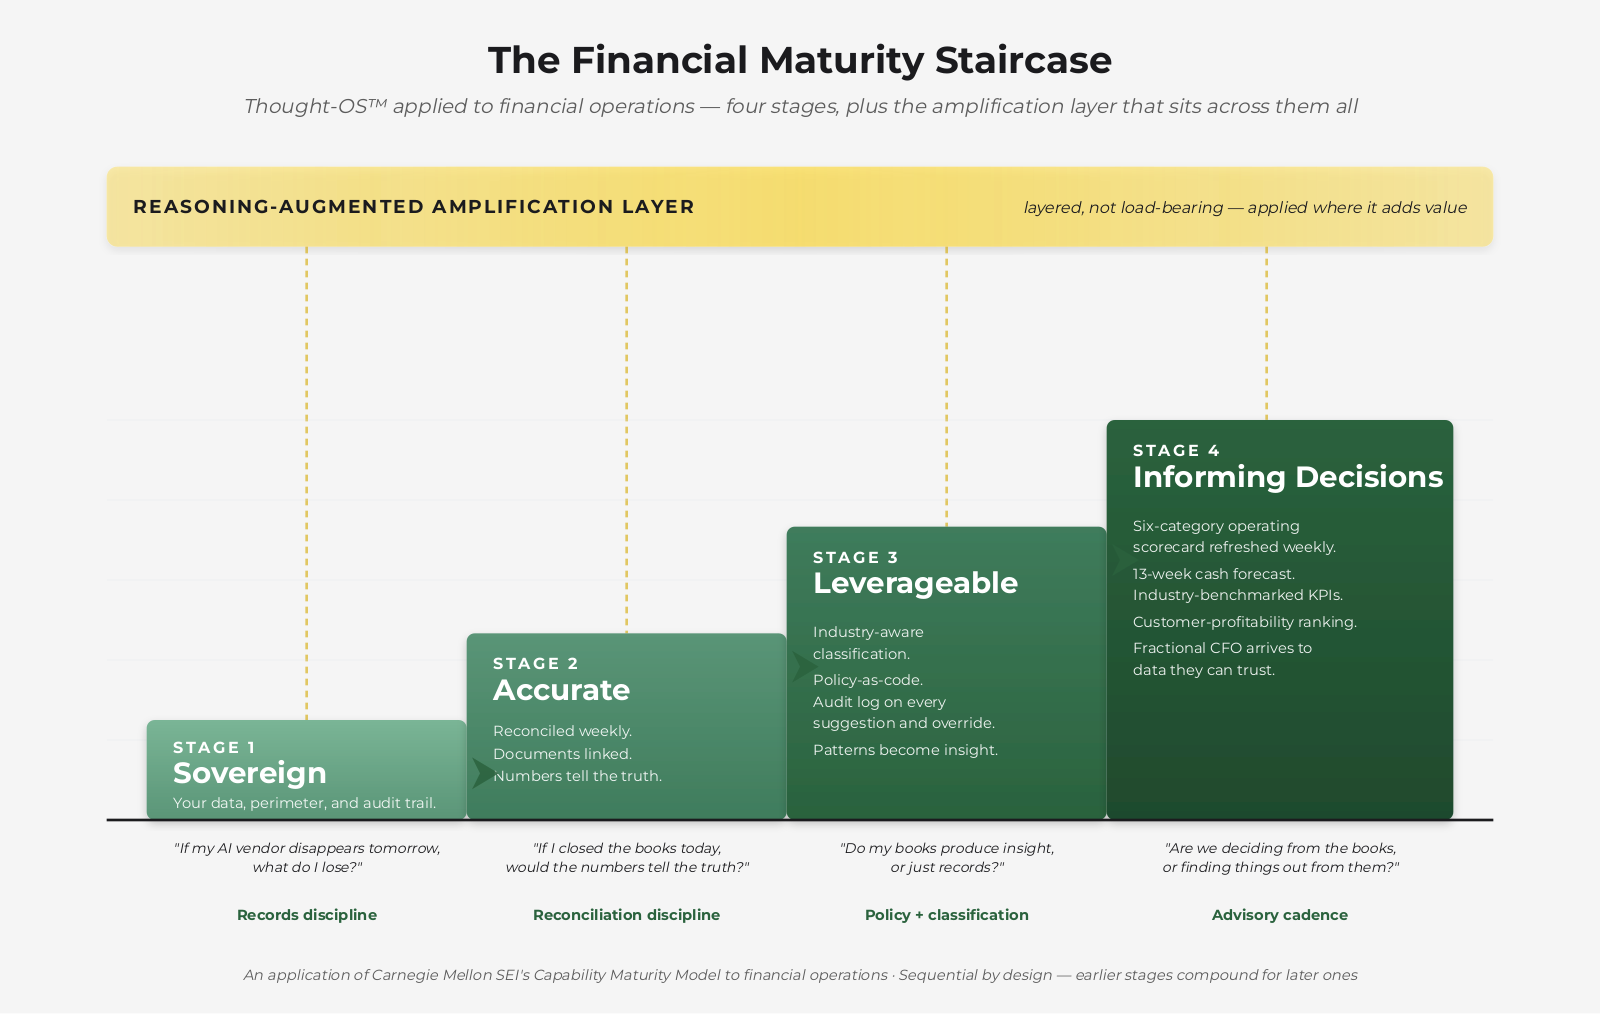
the four-stage Financial Maturity Staircase: Sovereign, Accurate, Leverageable, Informing Decisions. This paper lives on the top rung.
The problem: clean books are necessary, but not sufficient
A business that has climbed the first three rungs of the Financial Maturity Staircase — Sovereign, Accurate, Leverageable — has something rare: books it can trust. Reconciled. Classified. Documented. Auditable on any given Tuesday.
And then the owner looks at them and asks the question the books can’t answer: where is this going?
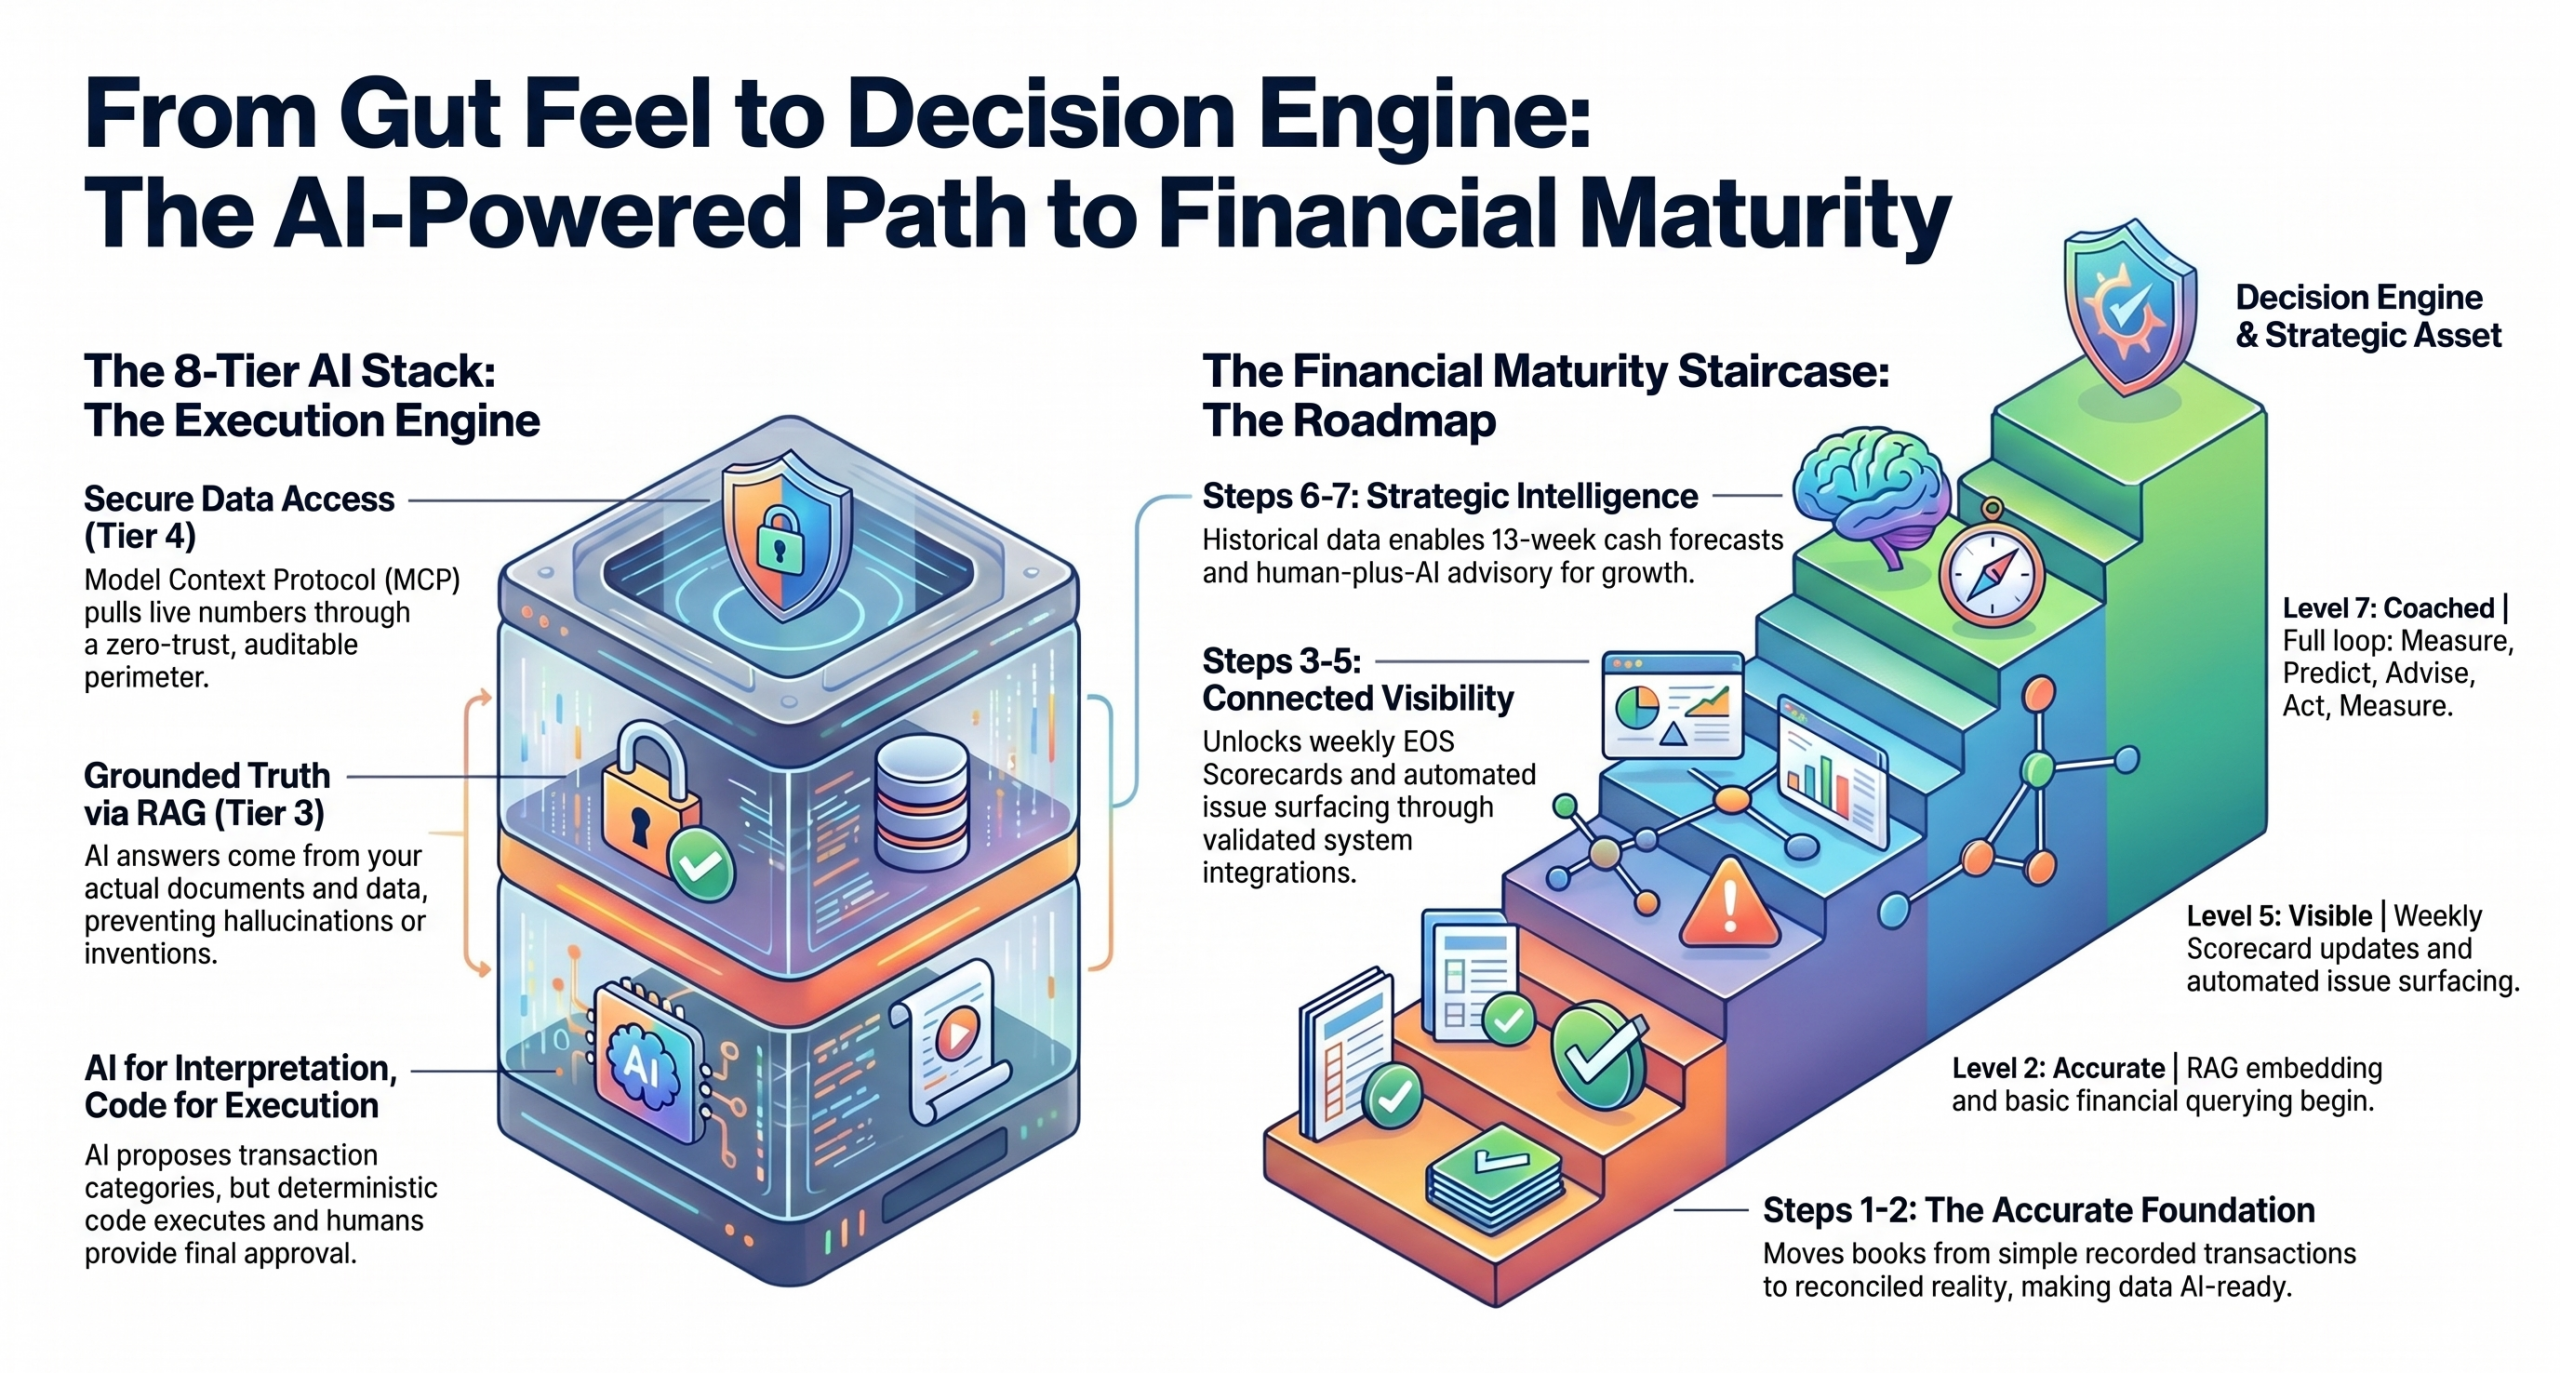
From Gut Feel to Decision Engine: the AI-powered path up the Financial Maturity Staircase — accurate foundation, connected visibility, strategic intelligence — turning trustworthy books into a forward-looking decision engine and a strategic asset.
Conventional financial reporting — including the genuinely excellent 14-indicator tradition that David Duryee and Tracy Bech laid out in 60 Minute CFO — is a high-quality rearview mirror. It tells you, precisely and defensibly, where you have been. That is worth a great deal. It is also only half of what an owner needs. The decisions that grow a business are forward-facing, and a rearview mirror does not show the road ahead.
The market’s answer in 2026 is to bolt an AI forecast onto the books and call it foresight. But a forecast that hands you a single confident number with no traceable "why" fails the same way black-box AI bookkeeping fails: it produces an answer no one can interrogate, and therefore no one can act on. You cannot build a hiring plan on a number you are not allowed to question.
The position of this paper: Stage 4 — Informing Decisions — is auditable foresight coupled to action. A forecast you cannot question is not a forecast. It is a guess wearing a suit.
Buyer test: Are we making decisions from the books, or finding things out from them?
Where the methodology comes from
Nothing here is invented from scratch. As with the companion papers, the method stands on work that has aged well, and ProjectBits’ contribution is the integration.
- David Duryee & Tracy Bech, 60 Minute CFO — the lagging foundation. Eighteen indicators across liquidity, safety, profitability, operating performance, and cash flow, anchored by a Survival Score (a modified Altman Z″ composite). The production engine carries Duryee’s eighteen plus four banker-canon extensions — quick ratio, debt service coverage, cash conversion cycle, and operating-cash-flow-to-net-income (earnings quality) — for a working set of twenty-two. This is the rearview mirror, and it is a good one. This paper builds forward from it.
- Mica Endsley — situation awareness. Perceive → comprehend → project. The three levels give the whole system its spine.
- Gary Klein — recognition-primed decision-making. Already one of the five lenses behind the practice; here it is the action layer.
- EOS / Traction — the discipline of separating leading indicators from lagging ones. Lands directly in the Quarterly Growth & Traction Review.
- Alan Miltz & Verne Harnish — the "Power of One." Sensitivity of cash to small moves in price, volume, cost, and the working-capital days.
- Greg Crabtree — Simple Numbers. Labor efficiency and core capital as forward drivers of profit.
- Billy Broas — Simple Marketing for Smart People. Belief building — the bridge from the financial model back to demand, and the seam where the next book opens.
What ProjectBits adds is the auditable integration: the automation that pulls these numbers from QuickBooks Online on a schedule, the lineage that lets every forecast figure trace to its source, and the policy-and-audit discipline that the first two papers established for the books, now extended to the forecast.
The spine: rearview, windshield, steering
The system runs on one vocabulary of metrics in three modes.
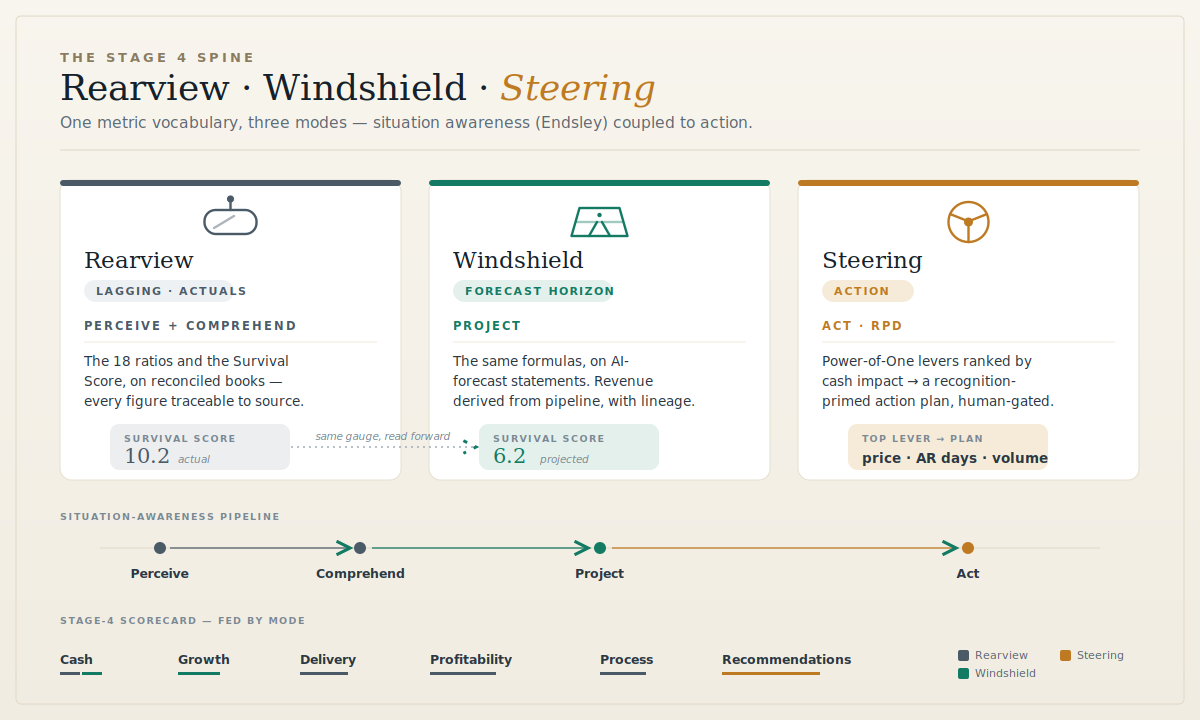
Rearview · Windshield · Steering, with the Survival Score read in both modes.
Rearview — lagging, on actuals. The eighteen ratios and the Survival Score, computed on reconciled books, every figure traceable to the transactions beneath it. This is Endsley’s perceive and comprehend: what happened, and what it means together.
Windshield — the forecast horizon. The same formulas, run on AI-forecast statements. A projected current ratio, a projected cash conversion cycle, a projected Survival Score — with no change to the math, only to the inputs. This is project: where the business is heading if nothing changes. Because the formulas are identical, the windshield is as auditable as the rearview; a projected number traces back through the forecast to the assumptions that produced it.
Steering — action. The Power-of-One levers, ranked by their cash impact for this specific business, become a recognition-primed action plan. This is the act — and it is the one place a human is always in the loop.
The Survival Score reads the same way in either mode. 2.30 → 4.90 over a year (rearview, actual) is the same instrument that will read a projected number once the forecast layer runs through it — same formula, same bands, same trace back to the inputs. An owner does not learn a new dashboard to see the future. They watch the same number, now with a horizon on it.
Buyer test: Can I see where this is heading — and does the number tell me what to do about it?
The auditable forecast: pipeline as the root
Here is the move that makes the windshield trustworthy: we do not forecast revenue. We derive it.
Revenue is the output of pipeline execution. So the forecast is built from three traceable sources and then shown:
- Recurring base — contracted revenue carried forward, net of the business’s own historical churn. The most certain dollar, because it is already under agreement.
- In-flight pipeline — named, open opportunities, each weighted by its real stage probability and expected close date. Not "the pipeline looks healthy" — these deals, at these probabilities, in these weeks.
- Modeled new business — what current lead-flow and historical conversion rates produce, lagged by the actual sales cycle. The least certain bucket, labeled as such.
Every forecast period carries a lineage record: an itemized account of why the model expects the number it expects, by source and by assumption. When an owner asks "why does this say $740K next quarter?" the answer is a list they can inspect and challenge — not "the model says so." This is what turns forecasting from guesswork into something a banker, a board, or a careful owner can stand behind. It is the show-your-work standard, applied to the future.
Buyer test: If someone hands me a forecast, can they show me why — by source and assumption?
It populates the scorecard you already have
Stage 4 has a six-category operating scorecard. The metrics in this paper do not replace it; they fill it.
| Scorecard category | What populates it |
|---|---|
| Cash | Cash conversion cycle, runway, the 13-week direct forecast, operating cash-flow margins, cash-to-earnings quality |
| Profitability | Gross / operating / net margins, EBITDA, return on equity, labor efficiency |
| Growth | Pipeline coverage, sales velocity, bookings, the pipeline-derived revenue forecast |
| Delivery | Utilization, realization, job-cost variance (from the PSA or field-service system) |
| Process | Reconciliation freshness, policy-fire trends, classifier disagreements (carried up from the AI Stack) |
| Recommendations | The Power-of-One lever ranking and the recognition-primed action plan |
| (headline) | The Survival Score as the single number an owner watches month to month |
The thirteen-week direct cash forecast in Cash is deliberately a different instrument from the indirect cash flow used in the lagging ratios: one answers "when does cash get tight, to the week," the other "how did the period’s structure hold up." Both belong on the scorecard; neither substitutes for the other.
The trust discipline — "what if the forecast is wrong?"
The same answer the AI Stack gives for the books applies to the forecast: the model proposes, the lineage exposes, and the human disposes.
Compute what’s supported; mark the rest. A given period computes every metric it has clean inputs for and marks the rest pending — never fabricated. A first-period client with no prior balance sheet gets twelve of the gauges and an honest note on the three that need history. Auditability by construction: a blank is labeled a blank.
Three tiers, by design. Deterministic math runs the ratios. AI interprets — estimating forecast parameters, flagging anomalies, drafting the read. A human approves anything that becomes an action or goes to a client. No AI step ever writes a ratio value or commits a decision on its own.
One legible number. The Survival Score gives an owner a single, bounded read — from distress to very strong — that they can watch without a finance degree, and trace into when it moves.
Buyer test: When the forecast is wrong, can I find out which assumption broke — and was a human in the loop?
Receipts — we run the windshield on ourselves
The disciplines in this paper are not theoretical for ProjectBits. They are the practice we run on the practice.
- The math is checked against a known-good source. The engine reproduces the 60 Minute CFO workbook’s Durson Distributors fixture exactly — Survival Score 10.2 for the fixture year — before it ever pointed at a live client. Forty-six locked tests (twenty-one on the ratio engine, twenty-five on the policy gate) make sure it stays that way.
- A live worked example. A sandbox client — Larson Industries, services firm — moved from FY2024 to FY2025 with the Survival Score climbing 2.30 → 4.90 (caution band to the edge of stable), revenue $806K → $1,008K, gross margin 70.0% → 63.5%, DSO 148 → 118 days, debt-to-equity −3.94 → 4.07. The full read identified nine flags (four critical, two moderate, three low) — every flag traceable to the specific ratio, the specific period delta, and the specific QuickBooks line item that drove it.
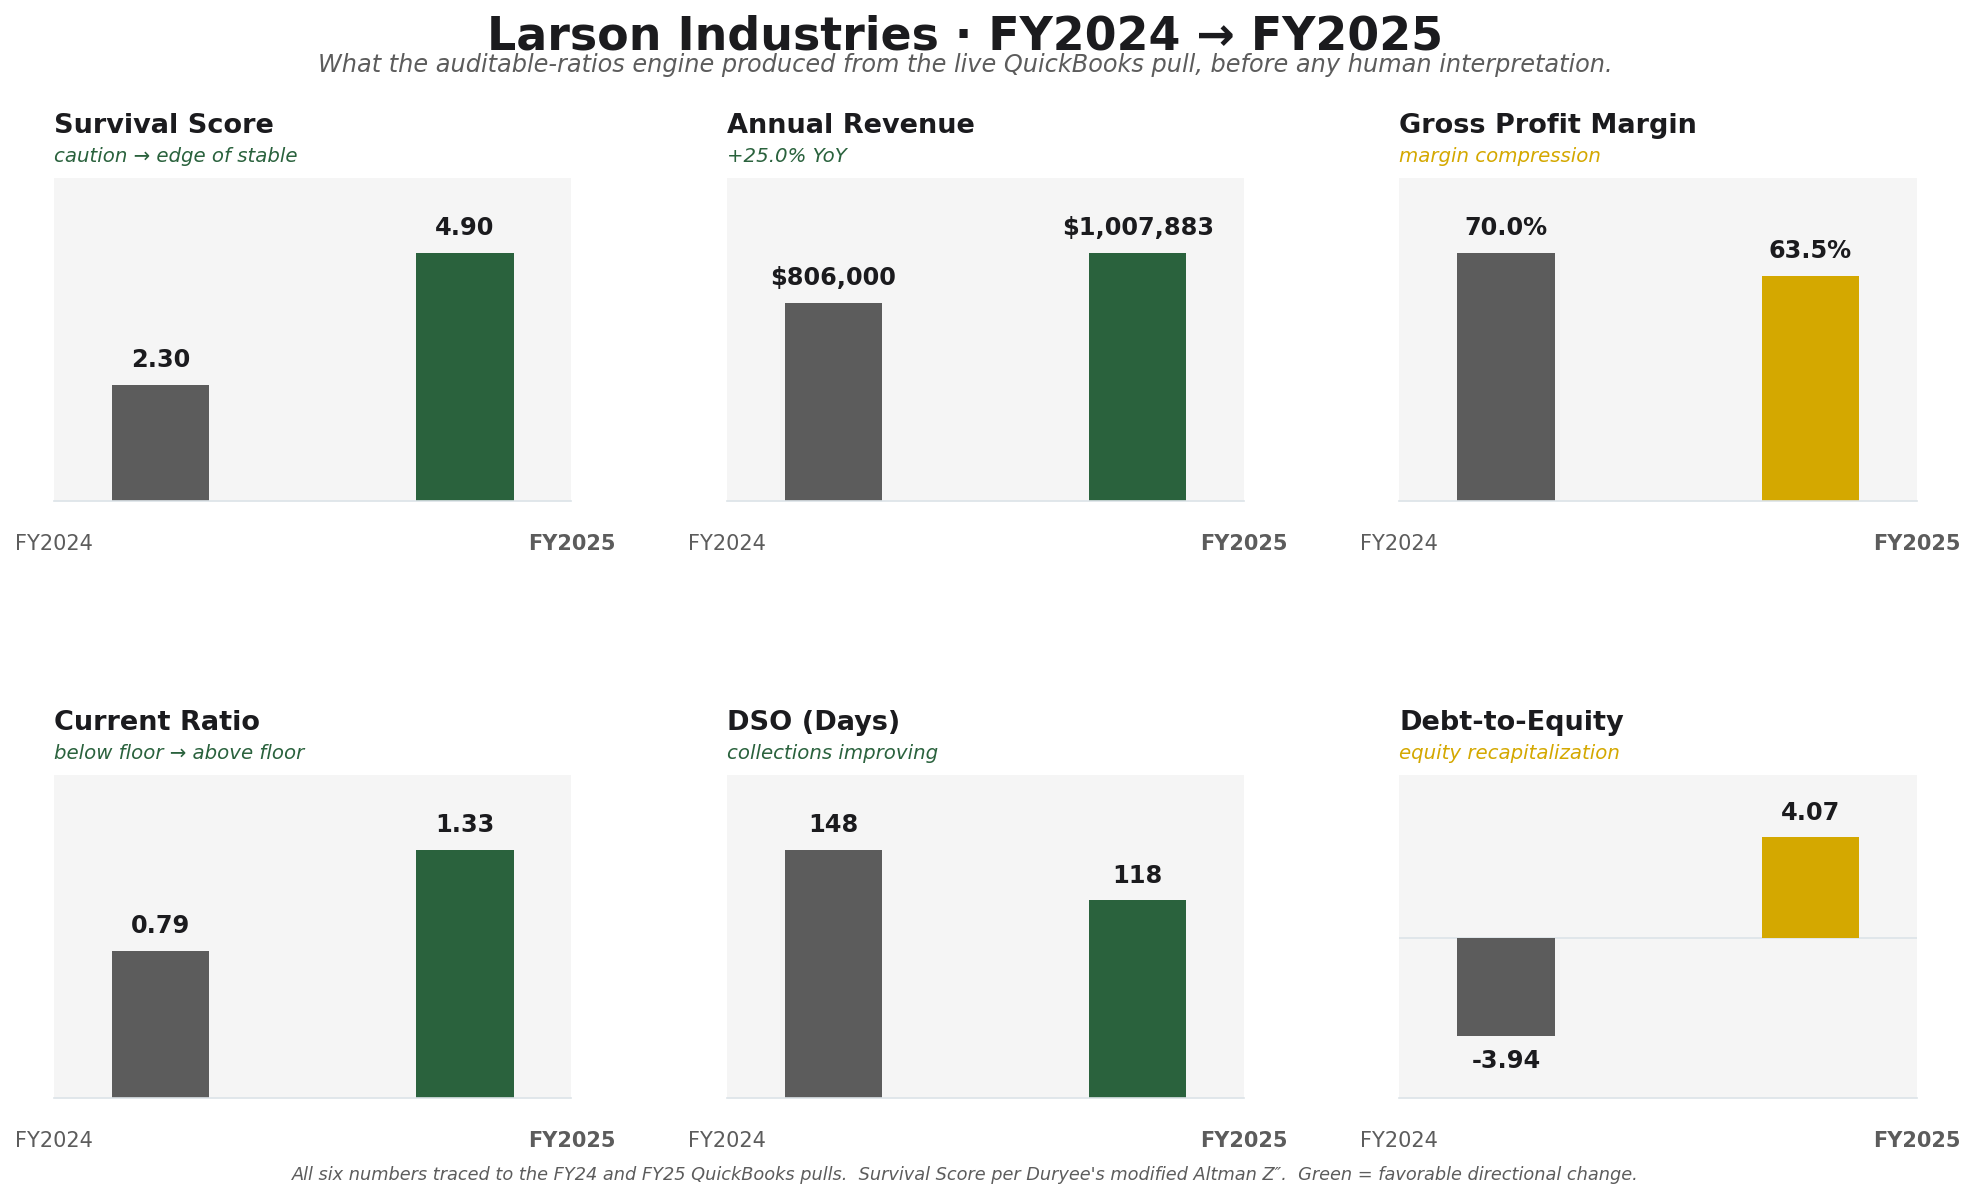
Larson Industries FY2024 → FY2025 across six headline metrics. Green panels show favorable directional change; mustard shows where the engine flagged compression or recapitalization risk. Same data the AI interpretation layer reads.
- Benchmarks are per-client, not generic. Twenty-seven default banker benchmarks live in Postgres, with three Larson-specific overrides applied where the services-firm reality differs from the default — for example, a 30-day DSO target loosened to 45 because the client’s industry collects slower than the cross-industry default.
- The action layer is curated, not invented. Twelve named plays — tighten AR collections; stretch AP terms; build a 13-week direct cash forecast; and so on — are reviewed by the practice owner before they enter the library. For Larson FY2025 the engine matched five proposed actions and skipped seven, with the skip reasoning recorded for review. No play is ever generated on the fly.
- The trust gate is enforced, not advisory. A policy gate (OPA/Rego) wraps the surface that goes to a client. On the Larson run, it blocked four of the five proposed actions from going client-facing until human review, and cleared one only after a caveat acknowledgement. The same gate runs twice — once at the internal-review surface, again at the client-facing surface — and the verdicts are persisted with the run.
- Every LLM call is traced. The interpretation and action-proposal calls go through a self-hosted observability stack (Langfuse), so every prompt, every model response, every token count, and the resulting span attributes are inspectable for any run, after the fact. The same accountability we apply to the books, applied to the AI calls that read them.
- Our own demand engine drives our own forecast. Outreach and referral activity — Apollo, Alignable, LinkedIn, Calendly — flows into a single CRM events table, and that pipeline is the root input to our own revenue projection. We are the rare case where one operator owns both the demand engine and the financial model it feeds, end to end.
- Belief building, measured. Each belief a prospect must hold before buying is mapped to the content that builds it and to the specific conversion stage it should move — so a content effort shows up as a measured lift in a named stage rate, not a vanity metric.
What’s still incomplete — and we say so. The forecast-lineage store and the leading-indicator instrumentation are partly running and partly specification. The 13-week direct cash forecast is library-ready as a play but not yet wired to live cash. We are building them the way we would walk a client through them — sequenced, measured, no leaping ahead. The architecture here is the working spec of the system we use to run our practice.
Where this goes
The bridge. Most fractional-CFO engagements stall in the first sixty days because the CFO arrives to a cleanup job. With clean Stage-3 books and this layer running, the CFO instead arrives to a populated scorecard and opens with strategy: "the system flagged these three things — which matters most this quarter?"
The offer. The CFO Operating System is delivered as four packages — an Operating System Diagnostic, the recurring CFO Control Tower, project-based Finance Process Buildout, and a Quarterly Growth & Traction Review. The leading-versus-lagging discipline in this paper lives most visibly in that last one, for firms running EOS.
And the loop. There is a larger idea worth naming. The staircase has read as a climb: readiness, then clean books, then decisions. But Stage 4 closes a circle. Decisions about where to spend feed demand generation; demand feeds pipeline; pipeline feeds the revenue forecast; the forecast feeds the next decisions. The mill makes flour, the baker makes bread — and the sale of the bread funds next season’s grain. The financial future is built upstream, in demand. That upstream engine — the demand operation — is the subject of the next book. Its blueprint is a nine-box marketing plan and a belief map; its proof-of-concept is the operation we run on ourselves.
This paper describes the baker. The bread is the decisions that grow the business. The next one is about the field the grain grows in.
Buyer test: Is my marketing spend judged by its downstream financial signature — or by clicks?
The entry path is the Tax Ready Assessment — a no-obligation scored diagnostic across 51 criteria in 9 categories. It places your business on the Financial Maturity Staircase, surfaces the specific gaps that matter most, and produces a 90-day roadmap. Yours to keep whether or not you engage further; the diagnostic is real on its own.
For firms where bookkeeping isn’t the obvious starting point — when the decisions side, not the records side, is the louder problem — a 20-minute conversation reaches the same diagnosis through different questions. Same methodology, different entry point.
Take the No-Obligation Assessment · Schedule 20 Min with Don
Changelog
| Version | Change |
|---|---|
| v1.1 | Live receipts replace illustrative ones — Larson Industries FY2024 → FY2025 worked example with Survival Score, flag, action, and gate counts; ratio count clarified (Duryee 18 + 4 banker extensions = 22 in production); voice pass on §3 and §7; observability discipline (Langfuse trace) named in receipts. |
| v1.0 | Initial draft. Establishes the Stage-4 "rearview / windshield / steering" spine; anchors on Duryee & Bech (60 Minute CFO) as the lagging foundation; maps metrics into the existing six-category scorecard; introduces the demand-to-decision loop and the tease for the third book. |
This paper is the third in the ProjectBits reading order. Read the series in order at projectbits.com/method. It is the Stage-4 advisory layer — what clean books are for.
ProjectBits Consulting · projectbits.com/method · Reston, VA. ProjectBits Thought-OS™ and Tax Ready Bookkeeping™ are trademarks of ProjectBits Consulting, Inc. Tax Ready Bookkeeping™ is used in connection with the book Tax Ready Bookkeeping: Let’s Make Your QuickBooks Business Tax Ready in 90 Days (published December 2025, ASIN B0G8TZBLFV). This paper is published for practitioner and client education.